Zum Hauptinhalt
Wenn Sie weiter auf dieser Webseite arbeiten möchten, bestätigen Sie bitte unsere Nutzungsrichtlinie:
Datenschutzhinweise
Urheberrecht
Fortsetzen
x
Kapitel drucken
Moodle-Handbuch
Mit Chart
können Torten- und Balkendiagramme erstellt werden.
Beispiel:
Klicken Sie im Inhaltsspeicher zunächst auf
und wählen Sie
aus.
 können Torten- und Balkendiagramme erstellt werden.
  und wählen Sie
  aus.
aus.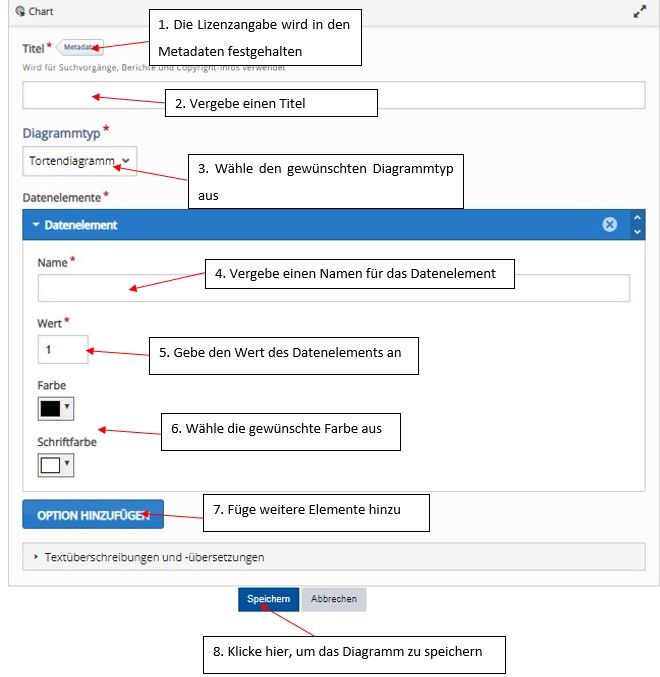 können Torten- und Balkendiagramme erstellt werden. und wählen Sie aus.